Demographics enable people to understand their neighbors even though they have not met them all. The information and statistics tell us who we share our space with and also what we can anticipate in the future. Trends can be forecast and that informs planning on all levels, public and personal. Plus, demographics are just plain interesting, so enjoy!
FOUR-YEAR AREA PLAN ON AGING, JULY 1, 2012 - JUNE 30, 2016, by the Area Agency on Aging for Napa and Solano.
You'll find all the sources listed in the full plan.
In these documents, you'll find all the amazing services for older people and lots of information about what we all can look forward to here in Napa County, with St. Helena statistics listed there too. It covers housing, health, transportation -- lots of good information to ponder.
The most informative part excerpted here.
CENSUS BUREAU INFORMATION COMPARED TO OTHER TOWNS OFTEN MENTIONED AS SIMILAR TO ST. HELENA
St. Helena Census Comparisons
This is a chart comparing Calistoga, Sonoma, Healsdburg, Mill Valley, Sausalito, Kentfield, Tiburon, Woodside and Orinda which includes housing and income statistics. These are statistics of the city limits only. The City of St. Helena cannot plan or control surrounding areas demographically or commercially, only the official city limits. For some areas, like schools and maybe public safety, there is a recognized "sphere of influence".
Top 100 Cities List
This list shows where we stand in the US against other similar towns for various reasons. Contrary to oft-stated popular opinion, we are very nice but not often in the top 100.
Although there are many verbal and print assertions that St. Helena is a wealthy city, it is important to base assumptions on realistic statistics and plan accordingly. Building our future on a lifestyle premise typical of an advertising campaign for upscale consumables is not going to yield the the solid municipal planning foundation needed to face tomorrow’s world.
The comparison chart of relatively recent Census Bureau statistics of cities that are often mentioned as “in St. Helena’s league” shows that we are quite different in several areas. Those differences are most reflective of our agricultural base and the many Hispanic people who are townspeople. As we celebrate and protect our agricultural heritage, it is appropriate to remember that we must also be responsible for including everyone who makes it possible. The duality of being a racial mix and yet not accommodating that mix is not socially or municipally sustainable. We are more than the image that is projected and we should not sacrifice the strength that comes from serving all people and gaining from the contributions of all people as we grow.
Some comparable realities from the census information that bear remembering as we plan:
- We are growing very slowly so worrying about run away growth and taking steps to control hypothetical growth just slows the economy down here even further.
- We have a very significant number of Latino people here who are often overlooked in terms of their needs and their contributions.
- Only half of us have a higher education.
- Only a little over half own their homes (not counting vacation rentals or 2nd homes in this) which means we have a meaningful number of renters.
- Comparatively, to other towns “in our league” we do not make very much money per capita and are middle class in terms of average household income.
Add to this some information recently mentioned at Council meetings, that approximately 40% of our 2776 living units are year around vacation rentals or second homes (transient occupancy). If true, that would leave 1665 units that are split between renters and owners and if 43.3% are renters (56.7% are owners); therefore, we have 944 units owned by those who live in their own houses, the group most typical of community volunteers. Many of these owners may be elderly and no longer active in community work, many may be commuters without the time to engage in committee work or may not be fluent in English so the actual number of people actively participating in community building, may be only half, which could be far fewer than in comparable towns and not many for a town of 6,000. This is important to consider in light of the new reality of decreasing government intervention and/or assistance for all cities in the US and in California now. There is much being written in the press advising communities to plan as though they were "on their own". It is time to lay long range plans to enable that if necessary.
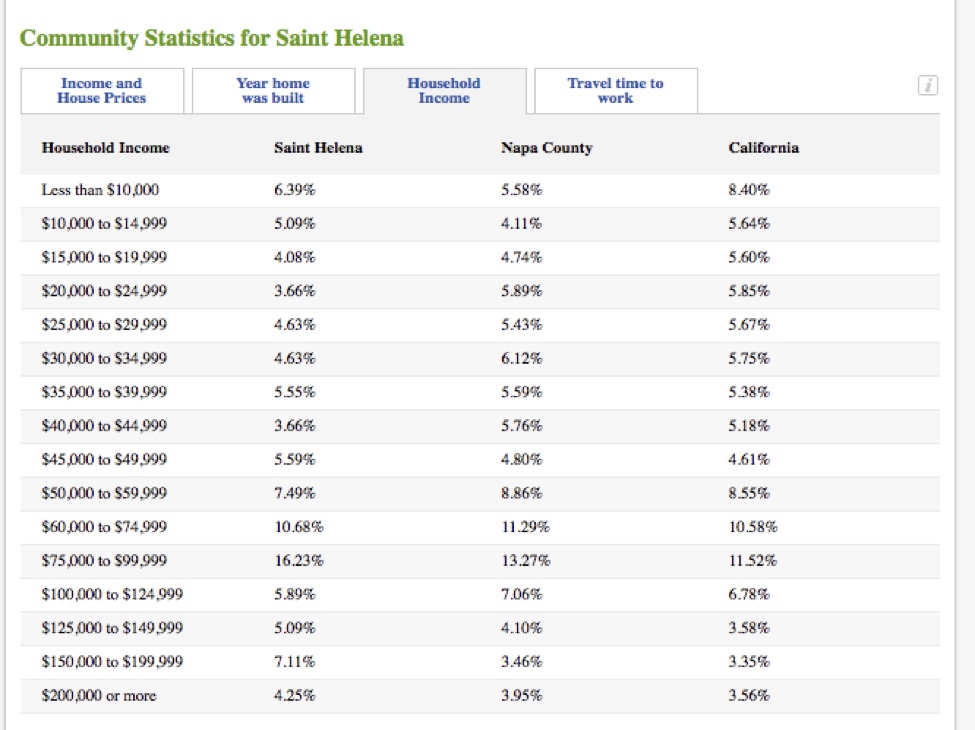
ST. HELENA INCOME CHART FROM Trulia
These statistics probably include surrounding areas, not solely within the city limits, since it is from a real estate based site.
And so, where are we going? Curious about what we can expect? Here are the official Projections From 2007 - 2035.
Immigrant and Housing Information:
Check these resources from the School of Policy, Planning, and Development at the University of Southern California known as PopDyanmics. Suffice to say that there is much misinformation about social integration -- here are the facts in California.
- Index of Children's Importance
- Immigrants and Housing Demand
- Demographic Futures for CA
- Contributions of Immigrants
- Insights into Aging
Other sources:
- Poverty Rates by County-PPI
- Nimby Chart -- Check to see if you have symptoms!
- Housing-Market-Links-Older-Whites-Young-Latinos_SacBee